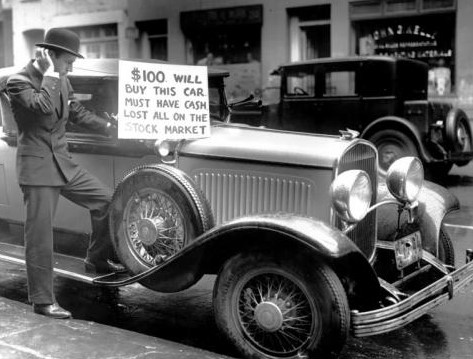
Stock market history has a wicked sense of humor. Just when investors decide the sky is falling, the market sometimes turns around, dusts itself off, and starts jogging uphill like nothing happened. Then, right when everyone gets comfortable again, it trips over a headline, a Federal Reserve comment, an earnings report, or a rumor whispered loudly enough on Wall Street to move billions of dollars before lunch.
That is why massive up and down moves in stocks in the same year are more common than many investors think. The stock market is not a smooth escalator. It is more like a crowded airport moving walkway during a power outage: sometimes fast, sometimes frozen, and occasionally full of people walking the wrong way with confidence.
The phrase “massive stock moves” sounds dramatic, but the data backs it up. The S&P 500 has repeatedly suffered large intra-year declines and still finished the calendar year with a gain. J.P. Morgan Asset Management’s long-running market history work shows that from 1980 through 2025, the S&P 500 experienced average intra-year drops of about 14%, yet annual returns were positive in most of those years. In plain English: a scary drop during the year does not automatically mean a bad year.
This article explains why sharp stock market declines and big rebounds often happen in the same year, what historical examples teach us, and how investors can stay calm when their portfolio chart looks like it was drawn by a squirrel on espresso.
Why Big Stock Moves Happen in the Same Year
Stocks move because expectations change. Prices are not just reflections of current earnings; they are votes on the future. When investors suddenly believe profits will be lower, interest rates will be higher, inflation will be stickier, or a recession is coming, stock prices can fall quickly. When those fears ease, even slightly, prices can bounce just as fast.
This is especially true for broad indexes like the S&P 500, which tracks many of the largest publicly traded companies in the United States. Because the index is weighted by market capitalization, the biggest companies can pull the whole market around like a Great Dane walking a small human.
1. Markets Reprice Faster Than People Process News
Investors often think in stories, but markets think in probabilities. A disappointing inflation report, a banking scare, a geopolitical shock, or a surprise earnings miss can instantly change the odds investors assign to future outcomes. Computers, hedge funds, pension funds, ETFs, options traders, and individual investors all react at once. The result can be a drop that feels too large for a single day, week, or month.
Then the reverse happens. If the feared disaster does not arrive, buyers return. Short sellers cover. Long-term investors rebalance. Algorithms flip from selling to buying. The same market that looked doomed on Tuesday may look “resilient” by Friday. Financial media then changes the headline from “Market Panic Deepens” to “Stocks Rally on Renewed Optimism,” which is a fancy way of saying nobody really knows what mood the market will be in tomorrow.
2. Interest Rates Can Swing Investor Behavior
Interest rates are one of the biggest drivers of stock market volatility. When rates rise, future corporate profits become less valuable in today’s dollars. Higher rates also make bonds and cash more competitive with stocks. That can pressure valuations, especially for growth companies whose profits are expected far in the future.
The 2022 market decline is a useful example. Inflation reached levels not seen in decades, and the Federal Reserve moved aggressively to raise interest rates. The S&P 500 fell into bear market territory, but the year also included powerful rallies. Investors repeatedly hoped inflation had peaked or that the Fed might slow its tightening campaign. Those hopes produced sharp rebounds, even though the broader year still ended badly for stocks.
3. Earnings Expectations Can Change Quickly
Stocks are not priced only on what companies earned last quarter. They are priced on what investors believe companies may earn next year, three years from now, or even ten years from now. A small change in expected revenue growth, margins, or demand can create a large change in price.
This effect is even stronger for individual stocks. A company can lose 30% after a weak earnings report and then gain 40% months later if management restores confidence. That does not mean the business magically transformed overnight. It means the expectations bar moved. Sometimes the market punishes a stock for being less perfect than hoped, then rewards it for being less terrible than feared. Wall Street is nothing if not emotionally complicated.
Historical Examples of Massive Up and Down Moves
Looking at history helps investors understand that stock market whiplash is not rare. It is part of the package. The long-term return of stocks exists because investors are paid to endure uncertainty, bad headlines, recessions, inflation scares, policy mistakes, valuation bubbles, and the occasional market tantrum that makes everyone suddenly interested in “safe assets.”
2020: A Crash, a Panic, and a Stunning Recovery
The 2020 COVID-19 crash remains one of the clearest examples of dramatic up and down stock moves in the same year. The S&P 500 dropped roughly 34% in only 23 trading days as the pandemic shut down large parts of the global economy. It was one of the fastest bear markets in modern U.S. history.
Then came the rebound. Massive fiscal stimulus, emergency Federal Reserve action, low interest rates, and investor confidence in an eventual reopening helped stocks recover with surprising speed. By the end of 2020, the S&P 500 finished the year with a double-digit gain. Investors who sold during the panic locked in losses; those who held through the storm experienced one of the most unexpected recoveries in market history.
2009: The Market Rose While the Economy Still Hurt
In early 2009, the mood was bleak. The global financial crisis had damaged banks, housing, employment, and investor confidence. Yet the stock market bottomed in March 2009 and began a powerful rally long before the economy felt healthy to most households.
This is one of the most important lessons in investing: the stock market often turns before the headlines improve. Stocks do not wait for everyone to feel comfortable. By the time the economy looks obviously safe, the biggest gains may already be in the rearview mirror, waving politely as investors chase after them.
1987: A Crash That Did Not End the Year in Disaster
The 1987 stock market crash was terrifying. On Black Monday, the Dow Jones Industrial Average fell more than 22% in a single day. The speed and scale of the decline shocked investors around the world. Yet the S&P 500 did not finish that year as badly as many people might assume. The market had already gained strongly before the crash, which softened the calendar-year damage.
This shows why calendar-year returns can hide the drama inside the year. A year can include a historic crash and still not look catastrophic when measured from January 1 to December 31. Annual return numbers are neat. Actual investing is messy.
2022: Bear Market Rallies Can Be Huge
Not every sharp rebound leads to a happy ending. In 2022, stocks endured a difficult year as inflation, rising rates, and recession fears pressured valuations. Still, the market produced several strong rallies along the way. These rallies were powerful enough to tempt investors into believing the bear market was over.
That is another common feature of volatile years: rallies inside downtrends. A stock or index can rise 10%, 15%, or even 20% and still remain in a broader bear market. The math can be confusing. A 30% decline requires a gain of nearly 43% just to break even. That is why investors should avoid assuming every rebound means the danger has passed.
The Math of Declines and Recoveries
One reason stock market volatility feels so strange is that losses and gains are not symmetrical. If a stock falls from $100 to $70, it has lost 30%. To return from $70 to $100, it must gain about 43%. A 50% decline requires a 100% gain to recover. This is why large drawdowns feel so painful: the recovery hill is steeper than the fall.
However, the same math also explains why rebounds can look enormous. After a stock or index falls sharply, even a partial recovery can produce eye-catching percentage gains. A move from $50 to $65 is a 30% gain, even though the stock may still be far below its previous high. Headlines love big rebound numbers, but investors should ask, “From what starting point?”
This is especially important for high-growth stocks, small-cap stocks, and speculative sectors. A stock can fall 70% and then double, leaving investors who bought at the top still deeply underwater. That does not make the rebound fake. It simply means percentages need context.
Individual Stocks Move Even More Than the Market
Broad market indexes can be volatile, but individual stocks can be downright theatrical. A single company can soar or collapse because of earnings, regulation, lawsuits, product delays, management changes, analyst upgrades, short squeezes, or social media enthusiasm. Sometimes the move is rational. Sometimes it looks like the stock chart ate too much sugar.
Technology stocks, biotech companies, banks, energy producers, and heavily shorted names often experience especially large swings. A drug trial result can change the value of a biotech company overnight. A surprise oil price move can lift or crush energy stocks. A bank can face pressure if depositors lose confidence. A software company can drop sharply if growth slows by a few percentage points.
Recent market years have also shown the importance of index concentration. When a small group of mega-cap technology companies drives a large share of index returns, the broad market can look calm while individual stocks swing wildly underneath the surface. In other words, the S&P 500 may appear composed, while many of its members are backstage throwing chairs.
Why Investors Misread Volatile Years
Human psychology is not naturally built for investing. Our brains evolved to avoid predators, not to interpret Federal Reserve minutes or discounted cash flow models. When markets fall, fear feels urgent. When markets rise, greed feels logical. This emotional cycle causes investors to overreact to both losses and gains.
Losses Feel Bigger Than Gains
Behavioral finance research has long shown that people tend to feel the pain of losses more intensely than the pleasure of equivalent gains. A 10% portfolio decline can feel like a personal insult from the universe, while a 10% gain may feel like “normal progress.” This imbalance encourages panic selling during downturns and overconfidence during rallies.
Recency Bias Makes the Latest Move Feel Permanent
When stocks fall for several weeks, it becomes easy to believe they will keep falling forever. When stocks rally for several months, it becomes easy to believe risk has disappeared. Both beliefs are usually wrong. Markets move in cycles, but investors often extrapolate the most recent trend into infinity. That is how people become bearish near bottoms and euphoric near tops.
Annual Returns Hide the Roller Coaster
A calendar-year return is a clean number, but it hides everything investors had to endure to earn it. A year that finishes up 12% may have included a 15% drawdown. A year that ends flat may have included a crash, a rally, and three separate moments when financial television used the word “unprecedented” before breakfast.
This is why long-term charts can be misleading. They show the destination but not the nausea. To understand stock market returns, investors must study both the final result and the path taken to get there.
What Massive Up and Down Moves Mean for Long-Term Investors
For long-term investors, volatility is not a bug in the system. It is the price of admission. Stocks have historically delivered higher long-term returns than cash and many bonds, but those returns come with uncertainty. The market does not hand out wealth calmly. It makes investors sit through corrections, bear markets, false rallies, scary headlines, and expert predictions that age like milk.
The key is not to predict every move. The key is to build a strategy that can survive them.
Keep a Time Horizon That Matches Your Investments
Money needed in the next year or two should not be fully exposed to stocks. Short-term goals need stability. Long-term goals can usually tolerate more volatility. A retirement account for someone in their 30s has a different risk profile than a house down payment needed next spring. Mixing those up is how investors turn normal market volatility into personal financial stress.
Diversify Before You Need It
Diversification does not prevent losses, but it can reduce the risk of one stock, sector, or theme ruining your plan. Owning only the hottest stocks may feel brilliant during a rally, but concentrated portfolios can fall brutally when leadership changes. A diversified portfolio spreads exposure across companies, sectors, asset classes, and sometimes geographies.
Use Rebalancing as a Discipline
Rebalancing forces investors to sell some assets after strong gains and buy others after weakness. It sounds simple, but it is emotionally difficult because it often means trimming what feels exciting and adding to what feels disappointing. That is exactly why it can help. A rules-based process can reduce emotional decision-making during volatile years.
Avoid All-or-Nothing Market Timing
Trying to jump in and out of the market perfectly is extremely difficult. Investors who sell after a major decline must make two correct decisions: when to get out and when to get back in. The second decision is usually harder. Recoveries often begin when the news still looks awful, which means waiting for comfort can mean missing the turn.
Dollar-cost averaging can help reduce timing pressure. By investing a fixed amount at regular intervals, investors buy more shares when prices are lower and fewer shares when prices are higher. It will not eliminate losses, but it can create a calmer process in a noisy market.
How Traders and Investors Should Interpret Big Reversals
A huge rally after a selloff can mean several things. It may signal that the worst is over. It may be a bear market rally. It may be short covering. It may be a reaction to oversold conditions. It may be driven by policy support, earnings surprises, or simply too much pessimism getting unwound at once.
That is why context matters. Investors should ask questions such as:
- Did earnings expectations improve, or did prices simply bounce from oversold levels?
- Are interest rates helping or hurting valuations?
- Is the rally broad-based, or is it concentrated in a few mega-cap stocks?
- Are credit markets stable?
- Is investor sentiment still fearful, or has optimism returned too quickly?
- Does the move change the long-term investment thesis?
The goal is not to answer every question perfectly. The goal is to avoid confusing price movement with truth. A stock going up does not automatically mean the business is healthy. A stock going down does not automatically mean the business is broken. Price is information, but it is not the whole story.
Practical Lessons From Years With Massive Stock Swings
First, expect drawdowns. If history shows that double-digit intra-year declines are common, investors should not treat every correction as a once-in-a-lifetime event. Market declines are uncomfortable, but they are ordinary.
Second, avoid emotional selling. Panic often feels responsible in the moment, but it can become expensive if the market recovers quickly. Selling during a decline may reduce short-term anxiety, but it can also remove the investor from the rebound.
Third, respect risk before it shows up. The best time to check your asset allocation is before the market falls. If a 20% decline would cause you to abandon your plan, your portfolio may be too aggressive.
Fourth, understand that volatility creates both danger and opportunity. Long-term investors with cash, patience, and discipline can use declines to buy quality assets at lower prices. But this only works if they have a plan and enough liquidity to avoid forced selling.
Finally, remember that the market is not obligated to make sense on your schedule. Stocks can fall on good news and rise on bad news. They can rally during recessions and decline during economic growth. They can make investors look foolish in both directions. Humility is not optional; it is portfolio armor.
Experience Section: What It Feels Like to Live Through a Wild Market Year
Anyone who has invested through a volatile year knows that stock market history feels much easier to discuss after the fact. On a chart, a 30% decline looks like a neat dip. In real life, it feels like opening your brokerage account and discovering that your future plans have been placed in a blender with no lid.
The experience usually begins with confusion. The market falls a little, and investors tell themselves it is normal. Then it falls more, and financial headlines become louder. Analysts start using phrases like “technical breakdown,” “recession risk,” and “liquidity stress.” Friends who never talk about investing suddenly ask whether they should move everything to cash. Someone at a family dinner says they “saw this coming,” even though they also thought cryptocurrency was going to replace the dollar by Memorial Day.
Then comes the emotional negotiation. Investors check their accounts more often. A long-term portfolio suddenly becomes a daily scoreboard. The same person who once said they were investing for 30 years begins reacting to 30-minute candles. This is when discipline gets tested. The hard part is not understanding that markets recover eventually. The hard part is believing it when prices are falling and every headline seems designed to poke your nervous system with a fork.
When the rebound starts, it rarely feels trustworthy. Early rallies are often dismissed as temporary. Investors say, “This is just a bounce.” Sometimes they are right. Sometimes they are very wrong. The frustrating part is that the market does not send a calendar invite announcing the bottom. There is no polite email saying, “Dear investor, the panic phase has ended. Please resume compounding.” Recoveries often begin while the news is still bad, unemployment is still rising, earnings estimates are still being cut, or confidence is still low.
One common experience during massive up and down years is regret in both directions. Investors who sold regret missing the rebound. Investors who held regret not buying more. Investors who bought early regret not waiting. Investors who waited regret not acting. This is why a written investment plan can be so valuable. It gives you something to follow when your emotions are busy writing dramatic screenplays.
Another lesson from experience is that volatility reveals your true risk tolerance. It is easy to say you can handle a bear market when stocks are rising. It is much harder when your portfolio drops sharply and the future feels uncertain. A wild market year teaches investors whether their allocation actually matches their temperament. That knowledge can be uncomfortable, but it is useful. Better to learn it and adjust than to repeat the same panic cycle every few years.
The most seasoned investors often sound boring during volatile markets. They talk about cash reserves, diversification, rebalancing, tax-loss harvesting, time horizons, and staying invested. That may not make for thrilling cocktail conversation, but it works better than trying to outguess every market swing. In investing, boring is often underrated. Boring pays bills. Boring survives recessions. Boring does not sell everything because a red chart looked mean.
The real experience of massive stock moves is emotional, not mathematical. The numbers matter, but the behavior matters more. Investors who can stay calm, avoid forced selling, and keep buying quality assets through uncertainty give themselves a better chance of benefiting from the market’s long-term upward bias. The ride may still be bumpy. There may still be years when stocks fall hard, rise fast, and make everyone question their life choices before Thanksgiving. But that is the deal. Stock market returns are earned by enduring the ride, not by pretending the road is smooth.
Conclusion
Massive up and down moves in stocks in the same year are not market glitches. They are part of how markets process uncertainty. Prices fall when expectations deteriorate and rise when fears ease, sometimes with breathtaking speed. History shows that large intra-year declines are common, and many years with painful drawdowns still finish positive.
For investors, the lesson is clear: do not confuse volatility with failure. A sharp decline does not always mean the long-term case for stocks is broken, and a sharp rally does not always mean risk has vanished. The best defense is a thoughtful plan, realistic expectations, diversification, liquidity, and the humility to admit that short-term market moves are often impossible to predict.
Note: This article is for educational and informational purposes only. It is not personalized investment, tax, or financial advice. Investors should consider their goals, risk tolerance, and time horizon before making portfolio decisions.