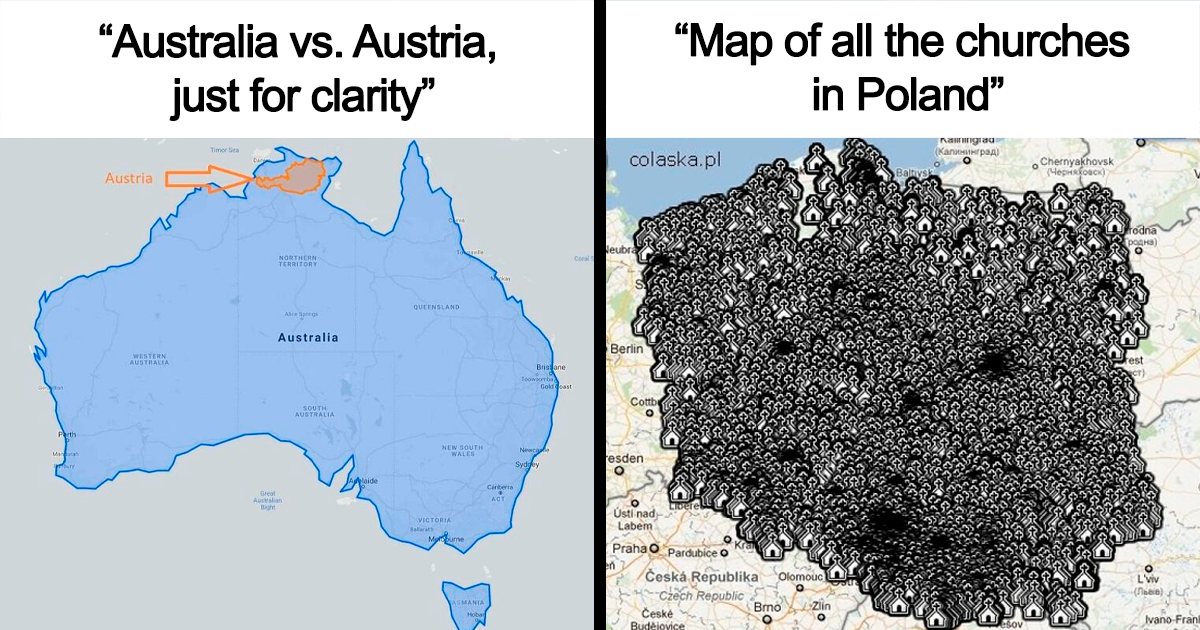
Some maps guide you across a continent. Some maps help ships avoid underwater hazards. Some maps explain election trends, weather patterns, city growth, or where to find the nearest taco truck when hunger becomes a civic emergency. And then there are terrible maps: gloriously useless little masterpieces that look geographic, sound confident, and explain absolutely nothingexcept perhaps why the internet should never be left alone with blank outlines of Europe.
The phrase “Terrible Maps” has become shorthand for a wildly entertaining corner of internet humor where geography meets bad logic, fake data, accidental genius, and visual chaos. These funny bad maps may label every country incorrectly, compare nations using absurd units, or answer questions nobody asked, such as “Which U.S. states are closest to being soup?” They are not helpful in the traditional sense. You would not use them to navigate a road trip unless your destination is “confusion.” But that is exactly the point.
Great maps organize reality. Terrible maps roast it.
What Are “Terrible Maps,” Exactly?
A terrible map is usually a map-shaped joke. It borrows the visual authority of cartographyborders, labels, colors, legends, arrows, data categoriesand then uses that serious format to deliver something ridiculous. The result is funny because maps normally ask us to trust them. When a map confidently claims that “every country is either Ohio, not Ohio, or spiritually Ohio,” the brain takes a tiny tumble down the stairs.
Online communities dedicated to funny maps and bad geography memes have turned these images into a full-blown genre. The best ones are not simply random nonsense. They often parody real map problems: misleading legends, strange projections, arbitrary borders, cherry-picked data, unclear labeling, and the overconfident tone of charts that pretend to explain the world in one glance.
In other words, terrible maps are funny because they are wrongbut they are often wrong in ways that reveal how real maps can also mislead us when they are poorly designed.
Why Bad Maps Are So Funny
Maps carry a built-in sense of authority. A sentence that says “Wisconsin is made of cheese energy” is silly. A color-coded map that says the same thing feels weirdly official. Add a legend, a north arrow, and maybe a dramatic title like “Global Cheese Influence Index,” and suddenly the joke wears a tiny academic blazer.
This is why terrible map memes work so well. They use the language of information design to say something completely unserious. A map of the United States divided into “places I have been,” “places I have not been,” and “places I refuse to acknowledge” is funny because it looks like demographic research but behaves like a group chat complaint.
There is also a second layer: geography is familiar enough that many readers can spot the mistake immediately. If a map labels Canada as “North Minnesota” or places Australia in the Atlantic Ocean, the joke lands fast. We know enough to laugh, but not so much that we feel like we are taking a cartography exam with a proctor named Gerald.
30 Types of Terrible Maps That Are So Bad, They’re Brilliant
Instead of copying any single viral gallery, let’s break down the kinds of maps that make the “Terrible Maps” trend so addictive. These categories represent the recurring styles of map humor that appear across social platforms, meme pages, and geography communities.
1. The Map That Answers a Question Nobody Asked
These maps have titles like “Countries Where I Could Beat a Goose in a Debate” or “States Ranked by How Much They Look Like They Would Own a Chainsaw.” The joke is the uselessness. No one needed the information, yet the map presents it like a government report.
2. The Overly Personal Map
Some terrible maps turn geography into emotional autobiography. A creator might highlight “countries where my ex has ruined the vibe” or “states I trust with my sandwich.” The data is subjective, the methodology is chaos, and the confidence is inspirational.
3. The Painfully Literal Map
A map labeled “World Map” might show only the word “world” written over and over. A map titled “Countries I Can Name” may include three countries and a suspiciously large blank space. These maps are not failing; they are failing on purpose.
4. The Border Disaster
These are maps where countries, states, or continents are rearranged with the enthusiasm of a toddler sorting laundry. Florida may migrate to Canada. Texas may become an island. Europe may be compressed into one tiny rectangle called “complicated.”
5. The Fake Data Map
Fake data maps are especially funny because they imitate serious infographics. A color gradient may claim to show “average dragon sightings per capita” or “percentage of people who would survive one night in IKEA.” The legend looks professional. The data source is probably “trust me, bro.”
6. The Technically Correct but Useless Map
Some maps are accurate yet absurd. A map showing “all U.S. states that contain the letter A” may be correct, but it does not exactly change civilization. These maps remind us that accuracy alone does not equal usefulness.
7. The One-Color Map
A map titled “Countries Where People Breathe Air” with every country colored the same is the cartographic equivalent of a shrug. It is terrible because it offers no meaningful distinction, which is also why it is funny.
8. The Confusing Legend Map
Legends are supposed to explain a map. Terrible maps sometimes include legends with categories like “yes,” “no,” “maybe,” “emotionally unavailable,” and “ask again later.” This kind of map turns data interpretation into fortune-telling.
9. The Projection Punchline
Real map projections already involve compromise because the Earth is round and paper is rude. Terrible maps exaggerate this by stretching countries into noodles, shrinking continents into crumbs, or making Greenland look like it has been hitting the gym since 1569.
10. The Mislabeling Masterpiece
Mislabeling is a classic. France becomes “baguette area.” The Atlantic Ocean becomes “big wet.” Antarctica becomes “penguin headquarters.” These maps are silly, but they also show how labels shape our understanding of place.
11. The Regional Stereotype Map
Maps that reduce regions to stereotypes can be funny when they are clearly playful and self-aware. A U.S. map that labels the Midwest as “casserole diplomacy” and California as “avocado headquarters” may not be academically rigorous, but it does understand brunch politics.
12. The Wrong Scale Map
Scale matters. A map that makes a city block look the size of a country or compares Rhode Island to Jupiter is terrible in the best possible way. It takes a real cartographic rule and tosses it into the ceiling fan.
13. The “Everything Is America” Map
This genre labels other countries as U.S. states or American cultural references. Italy becomes “boot-shaped New Jersey.” Canada becomes “polite Alaska.” The humor comes from extreme cultural tunnel vision.
14. The “Everything Is Europe” Map
The opposite version does the same thing with European countries. The United States becomes “large Germany with trucks.” Australia becomes “sunburn Britain.” It is geography as international teasing.
15. The Map That Hates Precision
Some terrible maps use vague labels like “up there,” “somewhere hot,” “probably mountains,” and “do not know, seems far.” They capture how many of us privately navigate the world before pretending to be adults.
16. The Unhinged Historical Map
History maps can be deeply informative. Terrible historical maps ask, “What if the Roman Empire included every place that sells Caesar salad?” It is inaccurate, but the pun is wearing armor.
17. The Weather Map Gone Rogue
A fake weather map showing “chance of soup,” “aggressive humidity,” or “emotional thunderstorms” feels funny because real weather graphics are already dramatic. Sometimes the forecast is simply: vibes.
18. The Map of Opinions Disguised as Facts
These maps rank places by categories like “best states for yelling at furniture assembly instructions.” They are clearly subjective, yet presented as official. That fake authority is the joke.
19. The Minimalist Disaster
A blank map titled “Places Where Nothing Has Ever Gone Wrong” is dark, simple, and effective. Terrible maps often thrive by removing almost everything except the punchline.
20. The Overloaded Disaster
At the other extreme are maps with 47 colors, 19 arrows, tiny text, and a legend that requires a law degree. They parody real visual clutter, where too much information becomes no information at all.
21. The Map That Uses Absurd Units
Forget miles and kilometers. Terrible maps measure distance in hot dogs, emotional baggage, washing machines, or “how long it would take a raccoon with purpose.” Absurd units make ordinary geography feel delightfully broken.
22. The Map Based on Wordplay
These maps turn country names into jokes. Turkey may be labeled “Thanksgiving.” Hungary becomes “needs lunch.” Chile becomes “spicy.” Is it clever? Sometimes. Is it dad-joke cartography? Absolutely.
23. The “My Knowledge of Geography” Map
Usually, these maps shade familiar places accurately and then label everything else “???” or “probably Europe.” The humor is self-deprecating, which makes it more charming than simply being wrong.
24. The Map with Suspiciously Specific Categories
Any map that divides the world into “owns a kayak,” “would borrow your charger,” and “has strong opinions about soup” is automatically terrible in a premium way. Specificity makes nonsense feel curated.
25. The Map That Accidentally Reveals a Real Problem
Some funny maps expose genuine design flaws. A misleading color scheme, missing scale, or confusing category system can make even real data look ridiculous. The joke becomes a lesson.
26. The Political Map With Zero Chill
Political maps often simplify complex realities. Terrible political maps push that habit to absurdity, reducing entire regions to one joke label. Done carefully, they parody oversimplification itself.
27. The Map That Treats Oceans Like Empty Space
Many real maps focus on land and ignore oceans. Terrible maps may label the Pacific as “too much water” or the Atlantic as “sequel ocean.” It is childish, but honestly, the Pacific is a lot of water.
28. The Transportation Map From a Nightmare
Subway-style maps are meant to simplify routes. Terrible versions turn every line into a spaghetti prophecy. They make you appreciate good transit design and fear transfer stations.
29. The Map That Looks Scientific but Isn’t
These are dressed in official colors, neat typography, and fake citations, yet the claim is pure nonsense. They are funny because they remind us that polished design can make almost anything seem credible.
30. The Map That Is Bad Enough to Become Art
The best terrible maps are oddly memorable. They make no sense, but they have personality. They prove that geography can be educational, absurd, and strangely beautiful all at once.
The Real Cartography Lesson Hidden Inside the Joke
Although terrible maps are designed for laughs, they accidentally teach a serious lesson: maps are never neutral little windows onto the world. Every map is a set of choices. The creator chooses what to include, what to leave out, what colors to use, which projection to apply, what labels to emphasize, and how much context to provide.
Professional cartographers, GIS analysts, journalists, scientists, and government agencies spend enormous effort making maps accurate and understandable. U.S. organizations such as the Geological Survey, the Census Bureau, NOAA, NASA, and the Library of Congress provide mapping data, historical collections, nautical charts, satellite imagery, and geographic resources that support research, safety, planning, education, and public understanding.
That is why terrible maps are such effective comedy. They take a respected format and gleefully break the rules. When a map has no scale, no useful legend, no reliable data, and no apparent reason to exist, it helps us appreciate the discipline behind good cartography.
Why Map Projections Make Everyone Argue
No discussion of bad maps is complete without mentioning map projections. A projection is the method used to flatten the Earth onto a two-dimensional surface. Unfortunately, Earth is a sphere-like object, and flat surfaces are stubborn. Something must be distorted: size, shape, distance, or direction.
The Mercator projection is one of the most famous examples. It is useful for navigation because it preserves angles, but it enlarges areas near the poles. That is why Greenland can look shockingly large on many familiar world maps, while equatorial regions may appear smaller relative to their true size. This does not make every Mercator map “terrible,” but it does show how a map that is useful for one purpose can be misleading for another.
Terrible Maps often turn projection confusion into comedy. They exaggerate distortion until the world looks like it has been stretched by a bored cat. The joke works because projection problems are real. Even serious maps are compromises; terrible maps simply announce the compromise with confetti and bad labels.
What Makes a Map Actually Bad?
A funny map can be bad on purpose. A real informational map is bad when it prevents people from understanding what it claims to show. Common problems include unclear legends, misleading color scales, missing sources, distorted categories, poor contrast, crowded labels, and data that is not normalized properly.
For example, a map showing total population by state may make large states look more important simply because they have more people. But if the topic is risk, rates, or access, a per-capita map may be more useful. A map of total coffee shops by state tells one story. Coffee shops per 10,000 residents tells another. Coffee shops within five minutes of a desperate Monday morning commuter tells the most important story of all.
The best map depends on the question. Terrible maps are funny because they often have no question, no method, and no shame.
Why People Love Sharing Terrible Maps
Terrible maps are highly shareable because they work instantly. You do not need to read a long explanation. The visual joke hits first, then the details reward a second look. A viewer may laugh at the title, then zoom in and discover six smaller jokes hidden in the labels.
They also invite participation. People love correcting maps, arguing about borders, pointing out mislabeled places, and adding their own jokes. Geography gives everyone something to latch onto: hometown pride, national identity, travel memories, school knowledge, and the universal thrill of saying, “Actually…” with dangerous confidence.
In that sense, terrible maps are not just memes. They are conversation starters. They turn geography into a social game.
How to Make a Terrible Map That Is Funny, Not Just Confusing
If you want to create your own terrible map, start with a familiar base: the United States, Europe, the world, a subway system, or a local neighborhood. Then choose a joke with a clear structure. The best terrible maps usually have one simple idea, not twelve competing ideas trying to win a cage match.
Use official-looking design elements sparingly. A clean title, a legend, and a few labels can make the joke stronger. Too much clutter kills the punchline. Remember, the map should look serious enough to be funny when it betrays that seriousness.
Most importantly, keep the humor playful. Punch up, parody systems, mock bad design, or make fun of your own limited geography knowledge. Avoid turning real communities into lazy stereotypes. A good terrible map is ridiculous, not mean-spirited.
My Experience With Terrible Maps: Why They’re Funnier Than They Should Be
The first time you fall into a terrible maps rabbit hole, it feels like opening a geography textbook that has been possessed by a stand-up comedian. You click one map because it looks silly. Then another. Then suddenly it is 1:17 a.m., you are staring at a map titled “Countries Ranked by How Much They Resemble a Potato,” and you are quietly wondering whether Belgium does, in fact, have potato energy.
What makes the experience so addictive is the blend of recognition and surprise. A normal map rewards knowledge. A terrible map rewards both knowledge and confusion. If you know geography well, you enjoy spotting the deliberate mistakes. If you do not know geography well, you enjoy the absurdity anyway. It is one of the rare internet genres where experts and casual viewers can laugh at the same image for completely different reasons.
There is also something comforting about seeing a serious format behave badly. Maps are usually associated with school, navigation, government reports, weather alerts, and road trips where someone eventually says, “I think we missed the exit.” They feel responsible. Terrible maps take that responsibility, put a party hat on it, and send it through a revolving door.
I also think terrible maps work because they mirror how people actually talk about places. Most of us do not carry perfect mental atlases. We carry emotional maps. We remember the city where the pizza was incredible, the state where traffic hurt our feelings, the country we dream of visiting, and the airport terminal where time lost meaning. A terrible map turns that private mental geography into a public joke.
For example, a real map may show regional climate zones. A terrible map might show “places where summer feels illegal.” A real map may show population density. A terrible map may show “areas where someone will definitely tell you their barbecue is the best.” The second version is not scientifically useful, but it captures cultural texture in a way that feels weirdly human.
That does not mean terrible maps should replace real ones. Please do not sail using a meme map. Do not plan a hiking trip using a chart labeled “mountains probably here.” Do not teach world capitals with a map that calls every capital “Steve.” But as humor, terrible maps are brilliant because they remind us that all visual information deserves a second look. Who made it? What is it showing? What is it hiding? Why is Ohio glowing?
The best experience with terrible maps is not just laughing at how wrong they are. It is realizing that the wrongness has structure. A great terrible map understands the rules of mapmaking well enough to break them creatively. It knows that a legend can create false authority. It knows that color can imply patterns. It knows that labels can reshape meaning. Then it uses those tools to tell a joke so confidently dumb that you almost respect it.
That is the magic of the genre. Terrible maps are bad in the same way a great parody song is bad: intentionally, skillfully, and with excellent timing. They make geography feel approachable. They poke fun at data culture. They turn borders and blobs into punchlines. And occasionally, between the nonsense and the fake legends, they teach us to be better readers of real maps.
Conclusion: Terrible Maps Are the Internet’s Weirdest Geography Lesson
“Terrible Maps” may look like pure silliness, but the trend works because it understands something important about maps: they are powerful storytelling tools. A map can inform, persuade, guide, confuse, or entertain. When the information is fake, the labels are absurd, and the legend is having a nervous breakdown, the result can still be strangely educational.
Funny bad maps remind us not to trust visuals just because they look official. They also remind us that geography does not have to be dry. It can be playful, weird, critical, and laugh-out-loud ridiculous. Whether the map compares countries to snack foods, mislabels oceans with emotional honesty, or divides the world into categories no reasonable person requested, it proves one thing: sometimes the worst map is the best joke.