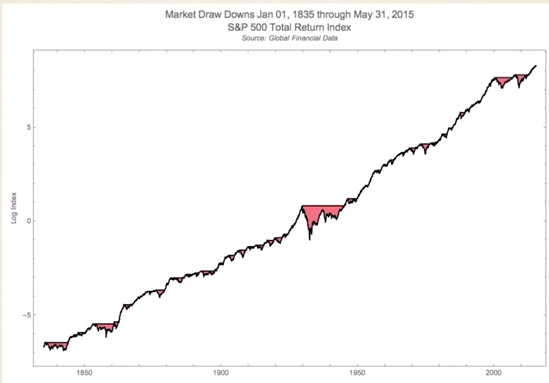
Note: This article is based on real historical and investor-education material and has been cleaned for web publishing, with no placeholder references or citation artifacts.
Wall Street has been handing out drawdowns for so long that it could qualify as a family tradition. Long before traders had six monitors, espresso machines, and opinions about every candle on every chart, investors were already learning the same painful lesson: markets do not move in a straight line. They sprint, stumble, panic, recover, and occasionally throw a full theatrical performance in the middle of a Tuesday.
That is what makes the story of stock market drawdowns so useful. Over roughly 180 years of U.S. market history, the names change, the technology changes, and the fashion thankfully changes, but the pattern keeps showing up. Booms build confidence. Confidence becomes overconfidence. Risk gets ignored. Liquidity disappears right when everyone wants it. Prices fall faster than most people thought possible. Then, eventually, recovery begins while the headlines are still acting like the sky is applying for permanent residence on Earth.
If you want to understand markets, do not just study the rallies. Study the retreats. Drawdowns reveal what investors fear, what policymakers misjudge, what business models can survive stress, and what discipline really looks like when your portfolio feels like it slipped on a banana peel.
What a Drawdown Actually Means
A stock market drawdown is the decline from a previous peak to a later trough. Simple idea, unpleasant experience. It is one of the cleanest ways to measure downside risk because it answers the question investors actually care about when things get ugly: How far did it fall before it got better?
That matters because average returns can be charming little storytellers. They tell you what happened over time, but not how terrifying the trip felt while it was happening. A portfolio may produce attractive long-term returns and still put investors through a sequence of stomach-dropping declines that make them question every life choice since opening a brokerage account.
Drawdowns also matter more than clever cocktail-party market jargon because they capture real investor behavior. It is one thing to say you are a long-term investor. It is another thing to watch a portfolio slide, day after day, while every financial headline sounds like it was written by a foghorn with anxiety issues.
Why “180 Years” Is More of a Historical Panorama Than a Single Spreadsheet
Here is the honest part that serious readers deserve: there is no single, perfectly consistent U.S. stock index that gives us one neat, uninterrupted, apples-to-apples line for a full 180 years. Early market history is reconstructed from exchange records, stock averages, banking histories, and later index data. Continuous monthly stock series commonly used in deep historical analysis begin in the 1870s, while the New York Stock Exchange itself traces its formal origin back to 1792.
So when we talk about 180 years of stock market drawdowns, we are really blending two lenses. The first is market history: panics, crashes, depressions, policy mistakes, and recovery cycles stretching back into the 19th century. The second is index-era market measurement: especially the later history of broad U.S. stock indexes that allow drawdowns to be quantified more cleanly.
That is not a flaw. It is actually a feature. Because the deeper lesson is bigger than any one index: markets have always been vulnerable to leverage, speculation, concentration, policy shocks, and human overconfidence. In other words, the software improved, but the operating system called “human nature” barely got a patch update.
The Long Arc of U.S. Drawdowns
1. The 19th Century: Panics Before Modern Indexes
Early American market history was less polished, more fragmented, and full of financial drama that could make a modern earnings season look like a nap. The Panic of 1873 marked the end of a long expansion and helped trigger a depression that lasted until 1879. Railroad speculation, international stress, credit strain, and shaky confidence all played a role. This was not just a bad quarter. It was a reminder that when finance outruns stability, the bill eventually arrives with interest.
The late 1800s also showed how closely markets were tied to banking structure. These were not clean little corrections with tidy labels. They were broader financial seizures that disrupted commerce, lending, employment, and public trust. The drawdown lesson from this era is plain: when markets and credit systems wobble together, declines become more than price events. They become economic events.
2. 1907: When Panic Helped Build the Modern Financial System
The Panic of 1907 was the first worldwide financial crisis of the 20th century, and it mattered not just because prices fell, but because the event exposed structural weakness in the American financial system. Trust companies were vulnerable, liquidity was scarce, and confidence evaporated with impressive speed. One day people trust the system, the next day they are staring at it like a raccoon in the garage.
This episode is one reason drawdowns are worth studying historically instead of emotionally. A sharp decline is often the market’s way of saying, “There was more fragility here than you noticed during the party.” The eventual push toward the creation of the Federal Reserve reflects a classic market truth: many reforms are written only after investors have already been introduced to the consequences.
3. 1929 and the Great Depression: The Textbook Catastrophe
If stock market drawdowns had a Mount Rushmore, 1929 would be chiseled into it with extra emphasis. In the years leading up to the crash, speculation expanded, leverage grew, and many investors acted as if rising prices were evidence of genius rather than a phase of the cycle. By September 1929, prices were already swinging sharply, with sudden declines and quick rebounds. That kind of action should have been a warning. Instead, many treated it like a halftime show.
Then came the collapse. The crash of 1929 became the defining example of how a roaring boom can mutate into a devastating drawdown. It is still the reference point because it combined euphoric speculation, fragile financing, and broad economic damage. The lesson is not simply that markets can fall hard. It is that excess confidence plus borrowed money can turn a decline into a generational scar.
4. 1987: Speed Can Be a Risk All by Itself
Black Monday in October 1987 delivered one of the most shocking market moments in history. The Dow Jones Industrial Average fell 22.6% in a single session. That one-day collapse remains legendary because it showed that market structure matters. Selling can feed on itself. Liquidity can thin out. Systems designed to reduce risk can amplify it instead. Humans panic manually; markets can panic electronically.
What makes 1987 especially instructive is that not every brutal drawdown becomes a long economic depression. Some crashes are about valuation, some about credit, some about sentiment, and some about market plumbing. Investors often treat all drawdowns as identical beasts, but they come in different species. Some maul growth for years. Others bite hard and vanish faster than expected.
5. The Dot-Com Bust: When Narratives Get More Expensive Than Earnings
The dot-com boom of 1995 to 2000 was a perfect case study in what happens when excitement outruns math. Internet and technology companies were treated as if profits were optional, cash flow was boring, and valuation discipline was for people who hated innovation and maybe puppies. The Nasdaq Composite rose nearly sevenfold during the frenzy, then collapsed from 5,048 in March 2000 to 1,139 in October 2002.
The dot-com drawdown is important because it was not driven by one single banking panic or a one-day market accident. It was a slow-motion unwind of excessive expectations. Investors did not just lose money. They lost a story they had started to believe too deeply. That is a recurring feature of market drawdowns: when a beloved narrative breaks, prices often fall farther than spreadsheets alone would suggest.
6. 2007–2009: The Great Recession and the Return of Systemic Fear
The global financial crisis reminded investors that modern finance can still produce old-fashioned panic. The 2007–09 crisis was deep, prolonged, and followed by a slow recovery. Housing excess, fragile balance sheets, complex financial products, and confidence breakdowns fed into a broad market collapse. This was not a niche problem. It was a system problem.
That distinction matters. A drawdown tied to one hot sector can be painful. A drawdown tied to the financial architecture of the economy is something else entirely. In those moments, investors stop asking whether a stock is cheap and start asking whether the system itself is stable. That is why the worst drawdowns feel so different. Prices fall, yes, but trust falls with them.
What 180 Years of Drawdowns Keep Teaching Us
Drawdowns Are Normal, Even When They Feel Like the End of Civilization
One of the best pieces of perspective comes from bear-market history itself. Charles Schwab notes that the average bear market lasts 409 days and involves a loss of 36%, while the average bull market lasts 1,866 days and gains 180%. Translation: declines are awful, but advances have historically lasted longer and climbed higher. Markets are rude in the short run and strangely generous in the long run.
Schwab also points out that the average bear market is about 14 months, with some much shorter and some much longer. That range is useful because investors often expect either instant recovery or permanent doom. Markets usually deliver neither. They deliver uncertainty, which is somehow less cinematic and more exhausting.
Diversification Helps, but It Is Not a Magic Force Field
Investor.gov says diversification is the classic “don’t put all your eggs in one basket” strategy, but it also makes an important point: diversification cannot guarantee you will not lose money in a broad market decline. That is worth underlining in bold, twice, and maybe with a trumpet. A diversified portfolio can reduce the severity of losses and smooth outcomes over time, but it cannot repeal gravity during a market-wide fall.
Vanguard makes a related point: defining a sound asset allocation and diversifying across stocks, bonds, sectors, and countries can reduce portfolio volatility and help guard against unnecessarily large losses. In plain English, you cannot avoid every storm, but you can stop building your financial house entirely out of paper napkins.
Volatility Feels Loudest to the Unprepared
FINRA describes volatility as something long-term buy-and-hold investors often treat like background noise. That is a useful mindset, because the market is always making noise. Sometimes it sounds like opportunity. Sometimes it sounds like a fire alarm. Either way, the investor with a plan usually has an advantage over the investor with a hot take.
Vanguard and FINRA both emphasize that turbulent periods are exactly when overreaction does the most damage. Selling after a drawdown may feel like taking control, but it often means converting a temporary decline into a permanent result. In other words, panic is an action, not a strategy.
The Investor Experience: What Drawdowns Feel Like in Real Life
Now for the part that charts cannot fully capture. A drawdown does not arrive as a neat academic concept. It arrives as a mood. It starts with discomfort, turns into irritation, and then graduates into full emotional theater. At first, investors say things like, “This is healthy.” Then they say, “This is annoying.” Then they stare at their accounts in absolute silence, which is often the purest language of all.
In a mild drawdown, people become obsessed with headlines. They refresh market apps too often, pretend they are “just staying informed,” and somehow memorize the exact intraday moves of indexes they barely mentioned during bull markets. In a deeper drawdown, every conversation becomes a macroeconomic seminar led by amateurs. Your barber has a recession call. Your cousin suddenly has a view on liquidity conditions. Your group chat becomes a museum of bad timing.
The strangest part is that the emotional pressure rarely matches the mathematical reality. A portfolio can still be aligned with long-term goals, still be diversified, still be built for a multi-decade horizon, and yet feel utterly broken because the daily experience of loss is so vivid. That is why drawdowns test behavior more than intelligence. Most investors do not fail because they never learned what diversification means. They fail because fear makes good principles feel embarrassingly inconvenient.
There is also the loneliness of drawdowns. In a bull market, everyone sounds brilliant. In a decline, even sensible decisions feel doubtful. Rebalancing into weakness can feel ridiculous in the moment. Staying invested can feel passive when headlines demand drama. Not selling can feel like doing nothing, when in fact it may be the hardest and most disciplined action available.
Experienced investors eventually notice a pattern. Drawdowns always feel highly specific while they are happening. This time inflation is different. This time rates are different. This time technology is different. This time geopolitics is different. And yes, the details are always different. But the emotional script is remarkably familiar. Confidence shrinks. Time horizons contract. People who once talked about “the next ten years” suddenly care only about the next ten minutes.
That is why surviving drawdowns is partly practical and partly psychological. The practical part is asset allocation, diversification, liquidity planning, and realistic risk tolerance. The psychological part is learning not to confuse discomfort with disaster. A drawdown can be severe without being permanent. It can be frightening without being irrational to endure. It can be painful and still be part of a normal long-term investing experience.
Over time, many investors come away from major drawdowns with a humbler and healthier mindset. They stop chasing perfect entry points. They respect cash needs. They think more clearly about risk. They understand that resilience is not just about what you own, but about what you can stick with when the market stops flattering you. And that may be the biggest lesson in 180 years of stock market drawdowns: the market does not merely price businesses. It tests people.
Conclusion
Across roughly 180 years of U.S. market history, drawdowns have appeared in different costumes: banking panic, speculative mania, policy shock, structural failure, valuation collapse, or full-blown economic crisis. Yet the recurring lesson is almost boring in its consistency, which is exactly why it matters. Markets fall. Fear spreads. Recovery eventually begins before most people feel comfortable believing in it.
The investors who endure these periods best are rarely the ones with the flashiest forecasts. They are the ones who understand what drawdowns are, plan for them in advance, diversify intelligently, and refuse to let temporary chaos rewrite long-term goals. History does not promise a smooth ride. It promises turbulence. But it also shows, again and again, that staying rational during a drawdown is often where long-term investing stops being theory and starts becoming skill.