Standing on the bridge of a cargo ship, an experienced captain can read the ocean remarkably well. The shape of the swell, the rhythm of the hull, and even the way unsecured objects begin plotting their escape across a table can reveal that conditions are changing. However, eyesight and instinct have limitsespecially at night, in fog, or when several wave systems arrive from different directions.
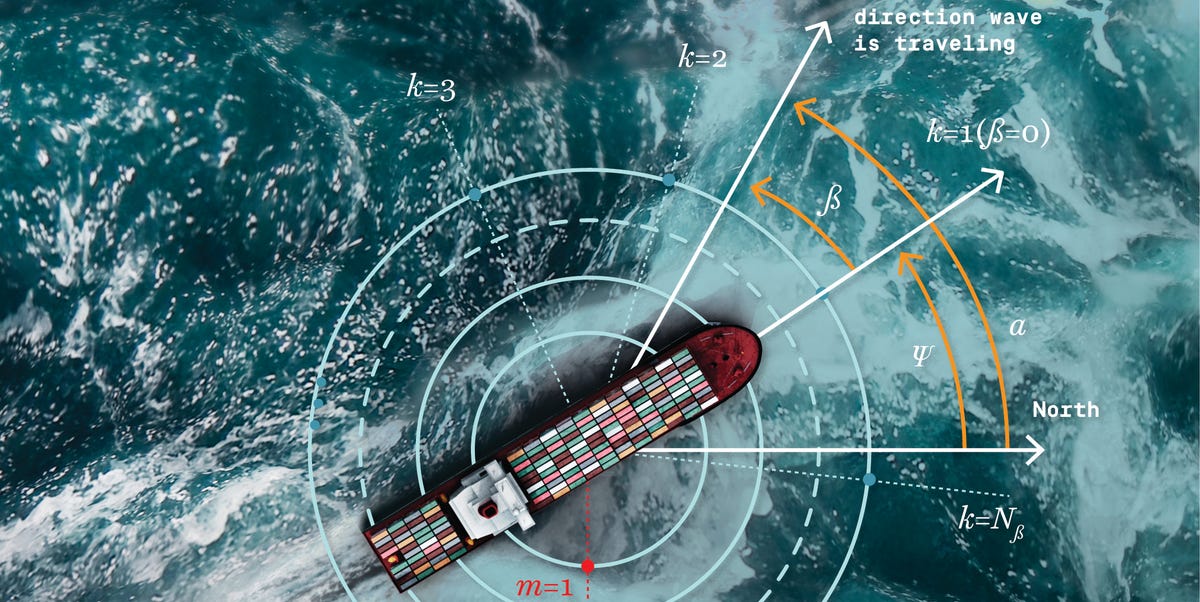
This is where mathematics earns its sea legs. Researchers are developing methods that use a ship’s own movements to estimate the waves surrounding it. Instead of treating rolling, pitching, and heaving as annoying side effects of ocean travel, the system treats them as valuable measurements. With the right equations, a cargo vessel can become a gigantic floating sensor capable of describing the sea beneath it.
The result is not a crystal ball bolted beside the radar. It is something more practical: near-real-time sea state estimation that can support safer course changes, smarter speed decisions, better cargo protection, and more accurate voyage planning.
Note: The phrase “see into the future” is a metaphor. These mathematical systems do not predict every individual wave. They estimate the current wave environment and combine that information with forecasting and optimization tools to improve decisions about what the ship is likely to encounter next.
Why Cargo Ships Need a Better View of the Ocean
Modern container ships are enormous, but size does not make them immune to rough seas. Large vessels can roll, pitch, yaw, bend, slam into waves, and experience powerful accelerations that travel through the hull and container stacks. A ship may look like a steel skyscraper lying on its side, yet the ocean still gets the final vote.
Wave height matters, but it is only one part of the problem. Captains and engineers also care about wave direction, frequency, period, and the distribution of energy across the sea. A moderate wave approaching from an unfavorable angle can sometimes create more troublesome motion than a larger wave arriving from another direction.
Some ships use dedicated wave radar, satellite products, weather-routing services, or data from ocean buoys. These tools are valuable, but each has limitations. A buoy may be far from the vessel. A regional forecast may not perfectly describe local conditions. Radar equipment adds cost and may struggle with certain sea states or environmental interference.
A ship, however, is already sitting in the exact water that needs to be measured. It is moving in response to every swell around it. The mathematical challenge is to work backward from those movements and determine what the waves must be doing.
The Wave Buoy Analogy: Turning a Ship Into a Sensor
The central idea is known as the wave buoy analogy. A conventional wave buoy rises, falls, tilts, and drifts as waves pass beneath it. Sensors record those movements, allowing oceanographers to estimate wave height, direction, and period.
A ship responds to waves too, although its behavior is far more complicated. It has a long hull, an uneven distribution of mass, cargo stacked above deck, engines, tanks, and a distinct bow and stern. It is also moving forward rather than politely waiting in one spot like a buoy with excellent manners.
Despite these complications, the same basic principle applies: waves produce motion, and measured motion contains information about the waves.
Six Motions Tell a Detailed Story
A vessel can move in six primary ways:
- Heave: vertical movement up and down
- Roll: rotation from side to side
- Pitch: rotation of the bow and stern up and down
- Surge: forward and backward movement
- Sway: sideways movement
- Yaw: rotation around the vessel’s vertical axis
Gyroscopes, accelerometers, inertial measurement units, and other onboard instruments can record these responses. The data may appear to be a noisy collection of wobbles, but mathematical processing reveals patterns associated with particular wave frequencies and directions.
Response Amplitude Operators Act Like a Translation Guide
Every ship responds differently to the same wave. A wide vessel may resist rolling more effectively than a narrow one. A long hull may react strongly to one range of wave periods and weakly to another. Cargo distribution, speed, heading, and loading condition also influence the response.
Naval architects describe these relationships using response amplitude operators, commonly called RAOs. An RAO is essentially a mathematical translation guide between incoming waves and vessel motion. It tells engineers how strongly a specific ship should respond to waves of different frequencies and approach angles.
RAOs can be calculated during ship design using hydrodynamic models, numerical simulations, towing-tank tests, or specialized marine-engineering software. Once calculated, they can become part of the vessel’s digital operating profile.
The Equation Behind the Ocean Detective Work
At a simplified level, the relationship can be written like a familiar algebra problem:
Measured vessel motion = ship response × wave spectrum + noise
The ship already knows its measured motion. Engineers have estimated its response characteristics through the RAOs. The unknown quantity is the directional wave spectruma description of how wave energy is distributed across frequencies and directions.
Solving for that unknown is called an inverse problem. Instead of starting with waves and calculating ship movement, the system starts with ship movement and reconstructs the waves that most likely produced it.
That sounds simple until the ocean contributes its usual amount of chaos. Sensors contain noise. Several different wave patterns may produce similar vessel responses. The ship may be relatively insensitive to certain wave directions. Small errors in speed, heading, loading condition, or hydrodynamic assumptions can distort the answer.
In other words, the equation may be short, but the ocean has found creative ways to make the homework difficult.
Why Bézier Surfaces Help Smooth the Answer
One important improvement involves Bézier surfaces. Bézier curves are widely used in computer graphics, automobile design, digital typography, and computer-aided drafting. Designers manipulate control points to create smooth curves without specifying every location along the line.
Researchers have adapted this concept to wave-spectrum estimation. A realistic directional wave spectrum should generally form a reasonably smooth surface rather than a collection of random spikes. Bézier-based constraints encourage the reconstructed spectrum to follow a physically believable shape.
The method can use multiple control points to describe peaks, slopes, and transitions in the estimated wave field. Compared with rougher smoothing approaches, this can preserve important details while suppressing implausible fluctuations caused by sensor noise.
Robust Optimization Keeps Bad Data From Taking the Wheel
Researchers have also applied robust mathematical techniques such as L1 optimization. This approach can reduce the influence of unusually large errors or isolated measurements that do not match the broader pattern.
Imagine that hundreds of motion readings agree, while a few are distorted by vibration, temporary sensor interference, or an especially enthusiastic slam of the bow. A less robust method might allow those outliers to drag the estimate in the wrong direction. L1-based methods are designed to be less easily bullied by a handful of troublesome values.
Combining physical response models, smoothness constraints, and robust optimization produces a more stable estimate of wave direction, significant wave height, and peak period.
How Wave Mathematics Can Protect Cargo
Once the system has estimated the sea state, onboard decision-support software can evaluate how the vessel is likely to respond if it continues at the same speed and heading. It can also compare alternative maneuvers.
For example, a model may determine that the ship is approaching a combination of wave period and angle associated with strong rolling. A small course adjustment could change the encounter angle and reduce roll acceleration. In another situation, slowing down may shift the frequency at which the vessel encounters waves, lowering the risk of slamming or excessive structural loading.
These calculations can support decisions involving:
- Container-stack acceleration and lashing loads
- Parametric or resonant rolling risks
- Bow slamming and water on deck
- Propeller emergence and engine-load variation
- Hull bending and fatigue accumulation
- Crew comfort and workplace safety
- Safe operation of cranes or offshore equipment
The objective is not always to avoid every large wave. That could produce a wildly inefficient route. Instead, maritime route optimization balances several competing goals: safety, arrival time, fuel use, schedule reliability, machinery limits, cargo restrictions, and passenger or crew comfort.
Math Predicts More Than Waves
Wave estimation is one layer of a much larger predictive-shipping system. Modern cargo vessels generate data from navigation equipment, engine sensors, weather services, satellite communications, radar, and the Automatic Identification System, or AIS.
AIS messages can include vessel identity, position, speed, course, and navigational status. When combined with historical routes, port-call records, weather observations, and traffic patterns, this information can support machine-learning models that estimate arrival times and likely trajectories.
Weather Routing Finds the Best Path Through Changing Conditions
Weather-routing software divides a voyage into possible paths and evaluates expected wind, waves, currents, and storms along each one. Optimization algorithms then search for a route and speed profile that satisfies operational constraints while minimizing a chosen cost.
The cost function may include fuel consumption, voyage duration, wave exposure, schedule penalties, emissions, or a weighted combination of all four. A route that is geographically shortest may not be fastest if it crosses a strong opposing current. The fastest route may not be safest if it places the vessel in dangerous beam seas.
Mathematics searches through these trade-offs far more quickly than a person could evaluate them manually. The final decision, however, remains with qualified mariners who understand conditions the model may not fully capture.
Ports Also Use Prediction to Prepare for Arrivals
Accurate vessel arrival estimates help terminals schedule berths, cranes, tugboats, pilots, rail connections, trucks, and labor. Better coordination can reduce vessel bunching, in which several delayed ships reach a terminal at nearly the same time and overwhelm available resources.
Some U.S. ports already use digital platforms that combine shipping information, cargo forecasts, and real-time operational data. Predictive tools can provide stakeholders with earlier notice of container volumes and vessel movements, allowing them to prepare equipment and transportation capacity before cargo reaches the dock.
This creates an important connection between wave mathematics at sea and supply-chain planning on land. A more reliable sea-state estimate can improve route and speed decisions. Those decisions improve the vessel’s estimated arrival time. A better arrival estimate helps the port prepare. One equation on a ship can therefore influence cranes, warehouses, trains, and delivery schedules hundreds of miles inland.
Safer Voyages Can Also Use Less Fuel
A cargo ship’s fuel consumption is strongly influenced by speed, hull condition, loading, wind, waves, and currents. Rough head seas increase resistance and force the engine to work harder. Poorly timed acceleration may burn extra fuel only to leave the vessel waiting outside a congested port.
Predictive systems can recommend a more efficient combination of route and speed. When a berth will not be available at the original arrival time, the ship may be able to reduce speed earlier in the voyage rather than racing across the ocean and idling near the destination.
This concept is often associated with virtual or just-in-time arrival. Better coordination helps a vessel reach the port when pilots, channels, tugs, and berths are ready. Reducing unnecessary high-speed operation and offshore waiting can lower fuel use, operating costs, and emissions.
The clever part is that efficiency does not require a futuristic propulsion system. Sometimes the biggest improvement comes from knowing when not to hurry.
What the Technology Still Cannot Do Perfectly
Wave-buoy mathematics is promising, but real ships introduce complications that controlled simulations do not fully reproduce.
Forward Speed Changes the Physics
A stationary vessel experiences waves differently from a ship moving at service speed. Forward motion changes the frequency at which waves are encountered. Currents further complicate the difference between speed over the ground and speed through the water. An inaccurate speed measurement can therefore produce an inaccurate sea-state estimate.
Real Waves Are Not Always Linear
Many practical models assume approximately linear relationships between waves and ship motion. Severe storms, breaking waves, slamming, green water, flexible hull behavior, and shifting cargo can produce nonlinear responses that are much harder to reconstruct.
The Ship’s Condition Keeps Changing
A vessel’s response depends on draft, trim, ballast, cargo distribution, fuel levels, structural condition, and even ice accumulation. A reliable system must update its model as those conditions change rather than relying forever on calculations made when the ship was new.
Uncertainty Must Be Visible
A prediction should not merely display one confident-looking number. It should communicate uncertainty, data quality, and the range of plausible outcomes. Captains need to know whether a recommendation is supported by excellent sensor coverage or held together by three questionable readings and a mathematical prayer.
The Future: A Digital Twin for Every Voyage
The next step is to connect sea-state estimation with a vessel’s digital twina continuously updated computer representation of the physical ship. The digital twin can combine hull geometry, loading condition, machinery performance, sensor readings, weather forecasts, and historical behavior.
Such a system could test hypothetical decisions before they are made. What happens to roll risk if the vessel changes heading by 10 degrees? How much fuel would be saved by slowing down for six hours? Would the revised arrival time conflict with the assigned berth window? How would a developing storm alter structural loads along each available route?
Instead of producing a single recommendation, the digital twin could compare scenarios and explain their consequences. Physics-based models would provide engineering discipline, while machine learning would identify patterns in large volumes of operational data. Edge computing aboard the ship could keep essential calculations available even when satellite connectivity is limited.
The most useful systems will not replace mariners. They will give mariners a clearer, faster, and more quantitative picture of the choices ahead.
A Practical Voyage Experience: What the Numbers Feel Like on the Bridge
The following is a realistic composite scenario based on common maritime operations rather than a claim of firsthand experience.
Imagine a heavily loaded container ship beginning a winter crossing of the North Pacific. Before departure, its route-planning system receives regional forecasts for wind, pressure, waves, and currents. The vessel’s loading computer supplies draft and trim data, while a digital model selects the correct response amplitude operators for the current cargo condition.
For the first two days, the ship encounters long swells from the northwest. Motion sensors record moderate pitch and very little roll. The wave-buoy model estimates the dominant direction and period, and its results broadly agree with the forecast. The bridge team sees no reason to alter the planned route.
During the third night, the roll signal begins to grow even though the reported significant wave height has changed only slightly. Looking at wave height alone might suggest that conditions remain manageable. The directional spectrum tells a more useful story: energy from a second wave system is arriving from a different angle. The two systems create a sea that is less comfortable and potentially more demanding for the container stacks.
The decision-support system evaluates several options. Continuing at the current speed would preserve the scheduled arrival but increase expected roll acceleration. A major diversion would reduce exposure but add considerable distance. A smaller heading adjustment, combined with a temporary speed reduction, changes the vessel’s wave-encounter frequency and reduces the predicted roll response.
The master reviews the recommendation alongside radar, weather charts, engine limits, nearby traffic, and professional judgment. The ship alters course modestly and reduces speed. The adjustment is not dramatic enough for an action-movie soundtrack. Nothing explodes, nobody shouts, and the coffee remains mostly inside the cups. That is precisely the point.
Over the next several hours, measured roll begins to decline. The sea has not become calmer; the vessel has changed how it interacts with it. Updated motion data is continuously fed back into the model, allowing the system to compare predicted and observed responses.
The altered route initially adds an estimated hour to the voyage. Later, updated port information indicates that the assigned berth will not be ready at the original arrival time anyway. The voyage optimizer recommends maintaining a slightly lower speed rather than recovering the lost hour through expensive acceleration.
Onshore planners receive the revised estimated arrival time. The terminal adjusts crane and labor scheduling, while inland logistics teams update truck and rail plans. The ship reaches the pilot station closer to its usable arrival window, burns less fuel than it would have during a high-speed recovery, and avoids a longer wait at anchor.
This scenario illustrates why predictive shipping technology works best as a connected system. The wave model does not independently command the vessel. It provides a better estimate of the sea. The motion model translates that estimate into vessel-specific risk. The route optimizer compares possible actions. Port data adds operational context. Human experts evaluate the complete picture and make the decision.
The experience also reveals a less glamorous truth about maritime innovation: the best outcome often looks uneventful. Cargo remains secured, machinery stays within safe limits, the port is prepared, and the vessel arrives without becoming the subject of tomorrow morning’s alarming headline.
Conclusion
Mathematics helps cargo ships “see” ahead by transforming motion into information. Through the wave buoy analogy, response amplitude operators, spectral analysis, Bézier surfaces, and robust optimization, a vessel can estimate the waves acting on its hull without depending entirely on a nearby buoy or dedicated wave radar.
When this sea-state intelligence is combined with weather forecasts, AIS data, route optimization, digital twins, and port-planning systems, it supports decisions that extend far beyond the bridge. It can help protect containers, reduce dangerous motion, improve arrival estimates, coordinate terminal resources, save fuel, and cut avoidable emissions.
The ocean will never become perfectly predictable. It is far too talented at improvisation. But every improvement in measurement and mathematical modeling gives crews more time to understand what is coming and choose a safer response. For a cargo ship carrying thousands of containers across a restless sea, that extra glimpse ahead can be enormously valuable.
Research synthesis: