The CAPE ratio has a talent for making investors uncomfortable at dinner parties. Mention it when the stock market is soaring, and suddenly everyone starts looking at their shoes. Mention it after a bear market, and people begin wondering whether they should have bought more when fear was on sale. The Cyclically Adjusted Price-to-Earnings ratio, better known as the CAPE ratio or Shiller P/E, is one of the most widely discussed tools for judging whether the stock market is cheap, expensive, or wearing a designer price tag it may not fully deserve.
Yet the CAPE ratio is not a crystal ball. It does not ring a bell at the top, send a polite text before a crash, or tell you when to move your entire portfolio into cash. What it does offer is more subtle and more useful: a historical framework. By comparing today’s market price with the average of inflation-adjusted earnings over the previous 10 years, CAPE gives investors a smoother view of valuation than a regular one-year P/E ratio. That makes it especially helpful when profits are temporarily depressed, inflated, or doing the accounting equivalent of interpretive dance.
What Is the CAPE Ratio?
The CAPE ratio measures the price of a stock market index, most commonly the S&P 500, against the average of its real earnings over the previous decade. “Real” means adjusted for inflation, and the 10-year average is designed to smooth out the business cycle. A normal P/E ratio may look strange during recessions because earnings can collapse quickly. CAPE tries to avoid that problem by asking, “What have companies earned across a full cycle, not just this awkward Tuesday?”
The basic idea is simple: if investors are paying a very high price for a long-term stream of earnings, future returns may be lower. If investors are paying a low price for those earnings, future returns may be higher. That relationship is not perfect, but over long periods it has been meaningful enough to earn CAPE a permanent seat at the market valuation table.
The CAPE Formula
In plain English, the CAPE ratio equals the current market price divided by the 10-year average of inflation-adjusted earnings. For the S&P 500, the formula can be understood like this:
CAPE Ratio = Current Index Price / Average Inflation-Adjusted Earnings Over the Past 10 Years
A CAPE of 15 means investors are paying 15 times the market’s average real earnings. A CAPE of 30 means they are paying 30 times those earnings. A CAPE near 40 means the market is not exactly browsing the clearance rack.
Why Investors Care About CAPE
Investors care about the CAPE ratio because price matters. Even wonderful businesses can produce disappointing returns when bought at extreme prices. Likewise, imperfect economies can produce excellent returns when stocks are purchased at bargain valuations. CAPE helps investors zoom out from the daily drama of headlines, interest-rate guesses, earnings beats, and whatever the market decided to panic about before lunch.
The ratio is especially useful for long-term expectations. It has historically been more informative over 10-year periods than over one-year periods. That distinction matters. A high CAPE can remain high for years, especially when interest rates are low, profit margins are strong, technology companies dominate the index, or investors are willing to pay premium prices for growth. In other words, CAPE can tell you the market is expensive without telling you when it will stop being expensive.
Historical CAPE Outcomes: What the Past Suggests
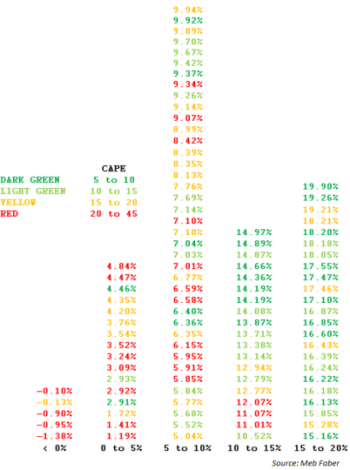
History does not repeat perfectly, but it does leave fingerprints. When CAPE has been very low, future long-term stock returns have often been attractive. When CAPE has been very high, future long-term returns have often been weaker. This does not mean every high-CAPE period immediately leads to a crash. Sometimes the market keeps climbing and makes careful investors feel like they brought a bicycle to a rocket launch.
Still, the broad pattern is hard to ignore. High valuations reduce the margin of safety. Low valuations improve it. The CAPE ratio helps investors understand where the current market sits within that long historical range.
Low CAPE Periods: When Pessimism Becomes Opportunity
Some of the best long-term buying opportunities in U.S. market history occurred when CAPE was low and investor confidence was even lower. The early 1980s are a classic example. Inflation had been painful, interest rates were high, and stocks were deeply unloved. That is usually how bargains arrive: not with confetti, but with bad headlines and a suspicious smell.
Investors who bought during low-valuation environments often benefited from two forces. First, earnings recovered over time. Second, valuation multiples expanded as confidence returned. When both happen together, future returns can be powerful. This is the cheerful side of CAPE: it reminds investors that terrible moods can produce excellent prices.
Average CAPE Periods: The Market’s Middle Lane
When CAPE sits near its long-term average, future outcomes have usually depended more on earnings growth, dividends, inflation, and interest rates. In these periods, the market is neither screaming “bargain” nor flashing “expensive” in neon. Returns can still be strong, but they are less likely to receive a major boost from valuation expansion.
For many long-term investors, average valuation periods are the easiest to misunderstand. They do not feel dramatic. There is no obvious emotional cue. The market may be fairly valued, moderately optimistic, or mildly nervous. CAPE helps provide context, but it still needs to be combined with portfolio discipline, diversification, and realistic return expectations.
High CAPE Periods: When Optimism Gets Expensive
High CAPE readings have often appeared near famous market peaks, including 1929 and the late 1990s technology bubble. These periods shared a common feature: investors had persuasive stories for why high prices were justified. In the 1920s, the story involved productivity and modern industry. In the late 1990s, it involved the internet changing everything. More recently, narratives around technology, artificial intelligence, dominant platform companies, and strong profit margins have supported elevated valuations.
The uncomfortable lesson is not that exciting stories are always wrong. Many transformative technologies really do change the world. The issue is price. A world-changing company or sector can still be a poor investment if expectations become too heroic. CAPE does not argue with innovation. It simply asks whether investors are paying so much for future growth that the future has to arrive wearing a cape.
CAPE and Future Returns: A Range, Not a Single Forecast
One of the biggest mistakes investors make is treating CAPE like a single-number forecast. A high CAPE does not mean the market must fall next year. A low CAPE does not mean stocks must immediately soar. Instead, CAPE is better understood as a range-of-outcomes tool. It tells investors whether the starting valuation has historically been associated with higher or lower future returns.
For example, when CAPE has been elevated, the following decade has often delivered lower real returns than average. But the path can vary wildly. The market may fall sharply, move sideways for years, or continue rising while future return potential slowly compresses. Valuation pressure can resolve through price declines, earnings growth, inflation, or a long period of underwhelming returns. Markets are creative like that.
Three Ways High CAPE Can Normalize
A high CAPE ratio can come down in several ways. First, stock prices can fall. This is the dramatic version and the one that gets the scary headlines. Second, earnings can grow faster than prices, allowing the denominator to catch up. This is the polite version. Third, the market can move sideways for years while inflation and earnings gradually reduce the valuation pressure. This is the boring version, but boring is a powerful force in finance.
Investors should remember that valuation normalization does not always require disaster. Sometimes it arrives through time, patience, and lower-than-expected returns. That may not be thrilling, but it is very different from assuming every high CAPE must end in a market earthquake.
What CAPE Gets Right
CAPE’s greatest strength is its focus on long-term valuation. It filters out temporary earnings noise and gives investors a clearer view of how much they are paying for normalized profits. This is particularly useful during recessions, when traditional P/E ratios can look artificially high because earnings have temporarily collapsed.
CAPE also encourages humility. When valuations are stretched, it reminds investors not to confuse recent performance with permanent law. A market that has delivered strong returns for 10 years may have borrowed some of those returns from the future. CAPE does not say the party must end immediately. It simply points out that the snacks are getting expensive.
What CAPE Gets Wrong or Misses
The CAPE ratio has limitations. It is backward-looking, meaning it relies on historical earnings rather than future earnings. Accounting rules have changed over time, which can affect comparisons across decades. The structure of the U.S. market has also changed, with technology and asset-light businesses representing a larger share of major indexes. These companies may deserve higher valuations than older industrial firms because they can produce high margins with less physical capital.
Interest rates are another major complication. When real interest rates are low, investors may be willing to pay more for stocks because bonds offer less competition. A CAPE of 30 in a high-rate environment may not mean the same thing as a CAPE of 30 in a low-rate environment. That does not make CAPE useless. It means investors should use it as one instrument on the dashboard, not the entire airplane.
CAPE in Today’s Market Context
Recent CAPE readings for the S&P 500 have been well above long-term historical averages. Depending on the data provider and calculation timing, current readings have hovered around the high 30s to low 40s. That places the U.S. market in historically expensive territory. The practical implication is not “sell everything and move to a cabin.” It is that investors should be careful about assuming the next decade will look like the strongest parts of the previous one.
High valuations can coexist with strong markets. They can also make future returns more fragile. If earnings disappoint, interest rates rise, or investor enthusiasm fades, expensive markets have less room for error. On the other hand, if corporate profits continue growing, productivity improves, and inflation remains manageable, high valuations can persist longer than skeptics expect.
How Investors Can Use CAPE Without Overusing It
CAPE is most helpful when it shapes expectations rather than triggers all-or-nothing decisions. Long-term investors can use CAPE to estimate whether broad market returns may be above or below historical norms. Retirement planners can use it to stress-test withdrawal assumptions. Portfolio builders can use it to compare U.S. valuations with international markets, value stocks, small-cap stocks, bonds, or cash-like assets.
What investors should avoid is using CAPE as a short-term trading signal. High CAPE markets can keep rising. Low CAPE markets can keep falling. Markets do not care about your spreadsheet’s emotional needs. The better approach is to let CAPE influence risk management, diversification, and return expectations without turning it into a market-timing superhero.
Practical Ways to Apply CAPE
A disciplined investor might use CAPE in several practical ways. If CAPE is extremely high, they may lower expected future returns in their financial plan, rebalance more carefully, or diversify beyond the most expensive parts of the market. If CAPE is low, they may remind themselves that fear often creates opportunity and that long-term expected returns may be more attractive.
CAPE can also help investors avoid emotional overconfidence. When the market has been rising for years, people often assume high returns are normal. CAPE pushes back by showing how much valuation expansion has contributed to those returns. If the market’s past gains came partly from investors paying more for each dollar of earnings, future gains may require earnings to do more of the heavy lifting.
Historical Outcomes Are Messy, and That Is the Point
The relationship between CAPE and future returns is real but imperfect. That imperfection is not a flaw; it is a reminder that investing happens in the real world, not in a clean laboratory. Wars, recessions, inflation shocks, policy changes, technological breakthroughs, tax law, investor psychology, and central banks all affect outcomes.
The best way to read CAPE is probabilistically. Low CAPE tends to improve the odds of strong future returns. High CAPE tends to reduce them. But odds are not guarantees. A skilled poker player can make the right decision and still lose a hand. A careful investor can respect valuation and still watch an expensive market become even more expensive. The goal is not perfect prediction. The goal is better judgment.
Experience-Based Insights: What CAPE Teaches Patient Investors
One of the most useful experiences related to the CAPE ratio is watching how differently people react to the same number depending on market mood. When stocks are rising, a high CAPE is often brushed aside with phrases like “this time is different,” “technology changed the rules,” or “cash is trash.” When stocks are falling, even a moderate CAPE can feel terrifying. The number may be objective, but investor interpretation is often emotional.
In practice, CAPE works best as a patience tool. It teaches investors that starting price matters, but it also teaches that valuation alone rarely controls the calendar. Someone who saw elevated valuations in the mid-2010s and abandoned stocks entirely missed years of gains. Someone who ignored valuation completely near the dot-com bubble learned that great stories can still become painful investments when bought at extreme prices.
Another experience is that CAPE can improve conversations about risk. Instead of saying, “The market feels risky,” an investor can say, “The market’s normalized earnings multiple is historically high, so I should consider a wider range of outcomes.” That is a calmer and more useful sentence. It shifts the discussion from fear to planning.
CAPE also helps investors separate business quality from investment price. The U.S. stock market can contain excellent companies and still be expensive. A great restaurant can serve wonderful food, but if the bill arrives with an extra zero, the experience changes. In the same way, strong companies do not automatically guarantee strong future returns if investors have already priced in years of success.
For long-term savers, the best lesson may be humility. CAPE does not demand that investors predict the next crash. It asks them to prepare for a realistic range of possibilities. That might mean saving more, diversifying globally, holding enough safe assets for near-term needs, or avoiding return assumptions that require everything to go perfectly. CAPE is less like a fortune teller and more like a weather report: it cannot tell you exactly when rain will fall, but it can suggest whether carrying an umbrella is sensible.
Finally, CAPE reminds investors that boring discipline often beats dramatic forecasting. Rebalancing, diversification, cost control, tax awareness, and realistic expectations may sound less exciting than calling the next market top. But these habits are usually more useful. CAPE’s real power is not in shouting “crash” or “buy.” Its power is in helping investors ask better questions: What am I paying? What future return am I assuming? What happens if returns are lower? Am I prepared for more than one outcome?
Conclusion: CAPE Is a Compass, Not a Clock
The CAPE ratio remains one of the most valuable tools for understanding long-term market valuation. It smooths earnings, adjusts for inflation, and places today’s prices into a historical framework. Its message is not always comforting, especially when valuations are high, but useful tools are not required to be charming.
The smartest way to use CAPE is as a compass, not a clock. It can point investors toward more realistic expectations, wider risk awareness, and better portfolio discipline. It cannot tell them exactly when the market will rise, fall, or wander sideways while everyone argues on financial television. Historical outcomes show that low CAPE periods have often rewarded patience, while high CAPE periods have often required more caution. The future will never copy the past perfectly, but the past still offers a map worth reading.
Note: This article is intended for general educational publishing and should not be treated as individualized financial advice.